Introduction
vnStat is a command line network bandwidth monitoring utility which counts bandwidth (transmit and received) on network devices and keeps the data in its own database. One of the interesting things about vnStat is persisting the monitoring through reboots. vnStat is able to monitor multiple interfaces at the same time and get you several output methods.
We are assuming that you have root permission, otherwise, you may start commands with “sudo”.
Install vnStat
For CentOS users:
For installing vnStat on CentOS you have to add “epel” repository first:
yum install epel-releaseThen you can install vnStat via “yum”
yum install vnstatFor Ubuntu and Debian:
apt-get install vnstatUsing vnStat
vnStat maintains it’s own database to keep all of your network information. to create a new database for your network interface run the following command. (make sure to replace your network interface name with the example, if you don’t know your interface name execute “ifconfig”).
run the following command to force vnStat to create a database for your network interface:
vnstat -u -i eth0To see all network interfaces available in your system, use the following command:
vnstat --iflistIf you want to start the vnStat as a daemon service, execute:
/etc/init.d/vnstat startThe most basic usage of vnStat is to simply run:
vnstat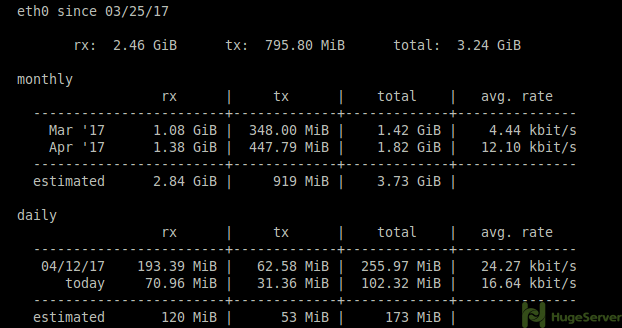
This gives a month wise summary of total network traffic from all active interfaces.
If you want to see this information for a specific interface you can use “-i” flag.
vnstat -i eth0We also can view hourly information in the form of a console-based graph for the last 24 hours:
vnstat -h -i eth0Using “-m” flag will show you the monthly statics:
vnstat -m -i eth0Live bandwidth usage can be monitored by using the “-l” command and top 10 days with the highest traffic can be monitored with the “-t” option. The commands for doing that are:
vnstat -l -i eth0vnstat -t -i eth0
Using vnStati
vnStati is used to produce graphical output for vnStat results, it creates images that representing the network traffic as graphs. it takes the required information to create graphs from vnStat and stores it in the specified location.
To take the output of a specific interface, we can use the “-s” flag. we will also be using “-o” flag to specify where the output file will be stored. (we name our output file eth0.png you may want to change it to anything you want):
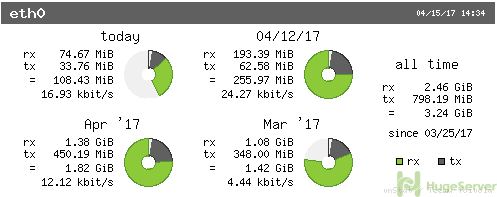
vnstati -s -i eth0 -o ~/eth0.pngWe can use the “-h” flag to get the hourly output from vnStati, it’s just like vnStat:
vnstati -h -i eth0 -o ~/hourly_eth0.pngAn example of the graphical output:
It is possible to get the total information by combining the traffic of multiple interfaces. for example, we can get both eth1 and eth0 records in a single file so we can compare them, you can do this with the command below:
vnstati -s -i eth0+eth1 -o ~/combined.pngCheck out Vnstat on its official Github for more information!
additional steps for centos 7 might be needed…
http://www.vassox.com/2019/02/18/installing-vnstat-on-centos-7/